
Ottawa’s September Real Estate Market
Ottawa’s resale market showed signs of shifting further in favour of buyers in September, as home sales remained relatively stable while the number of new properties coming to market increased significantly.
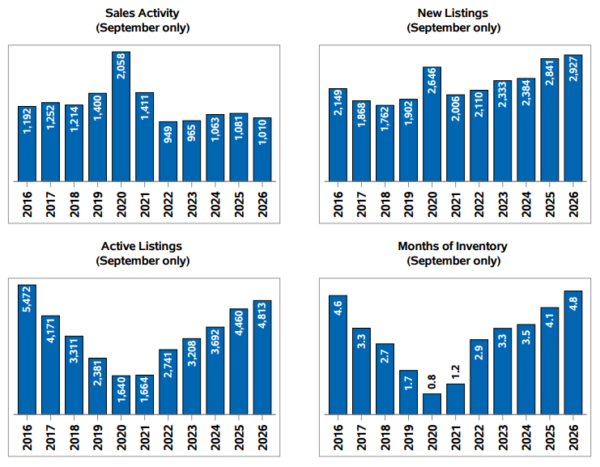
There were 1,010 residential properties sold through the MLS® System in September, a 6.6% decrease compared with September 2025. However, sales were slightly higher than August, increasing 0.8% from the 1,002 transactions recorded the previous month.
The bigger story was the amount of new inventory entering the market. September saw a substantial increase in new listings, giving buyers more options and contributing to a slower pace of absorption. This is an important trend to watch as we move further into the fall market.
More Homes Coming to Market
Ottawa recorded 2,927 new residential listings in September, an increase of 3.0% from the same month last year and a significant 38.1% jump from August.
While an increase in listings is typical as the market transitions into the fall season, September’s growth was considerably stronger than the historical norm. Over the past decade, the typical August-to-September increase in new listings has been about 12.9%.
Looking at the broader summer period, 7,576 properties were listed between July and September — the highest total for that three-month period since 2016.
At the same time, sales remained relatively subdued. The result is a growing gap between the number of homes entering the market and the number of homes being purchased.
Active listings reached 4,813 properties in September, up 7.9% from a year ago and 7.1% from August. This was the second-highest September level recorded since 2016.
For buyers, this increased inventory can mean more choice, more time to consider options and potentially greater negotiating power. Sellers, meanwhile, may need to be more strategic with pricing and presentation as buyers have more properties to compare.
Sales Remain Below Last Year’s Levels
Although September sales edged higher from August, the overall pace of activity remains below last year.
Single-family home sales declined 4.6% year over year to 535 transactions, while townhouse sales fell 3.5% to 329. Apartment sales experienced the largest decline, dropping 24.8% to 121 sales.
The apartment segment accounted for more than half of the overall year-over-year decline in Ottawa’s September sales.
For the July-to-September period, Ottawa recorded 3,336 sales, 8.2% fewer than during the same period in 2025. It was also the third-lowest summer sales total recorded since 2016.
Year to date, 10,288 homes have sold in Ottawa, down 6.9% compared with the same period last year. Total residential dollar volume is approximately $7.2 billion, representing a 7.3% decrease.
What Is Happening With Ottawa Home Prices?
Prices were relatively stable when looking at average and median sale prices.
The average residential sale price was $685,640 in September, down 1.0% from September 2025 and nearly unchanged from August.
The median sale price was $625,000, a modest 0.8% decrease from a year earlier and slightly higher than August.
The average sale price remained within a very narrow range throughout July, August and September, suggesting that headline prices have been relatively stable despite the changes in market activity.
However, the MLS® Home Price Index tells a somewhat different story.
Ottawa’s composite benchmark price was $623,500 in September, down 0.3% from September 2025 and 2.2% from August.
The HPI can provide a clearer picture of underlying price trends because it tracks a representative property rather than simply averaging the prices of homes sold during a particular month. Changes in the types of properties that sell can cause the average price to move even when overall property values are relatively unchanged.
September’s 2.2% monthly decline in the benchmark price was the largest August-to-September decrease in Ottawa’s HPI history, which dates back to 2005. Even after accounting for typical seasonal patterns, the benchmark declined 1.5%.
That is an important development to monitor, particularly alongside the increase in inventory and slower absorption. However, one month’s results are not enough to establish a long-term price trend.
Buyers Have More Leverage
One of the clearest signs of changing market conditions is the relationship between new listings and sales.
In September, the sales-to-new-listings ratio fell to 34.5%, compared with 47.3% in August. In simple terms, roughly one property sold for every three that came onto the market.
Months of inventory also increased from 4.5 in August to 4.8 months in September.
September recorded the lowest sales-to-new-listings ratio and highest months of inventory for the month in the past decade.
Properties also took longer to sell. The median time on market increased from 22 days last September to 27 days this September, while homes sold for an average of 97.5% of their asking price, compared with 98.1% a year ago.
Together, these numbers suggest that buyers are gaining more negotiating room, while sellers may need to adjust expectations around pricing and timing.
Apartments Continue to Face the Most Pressure
The apartment market remains the softest segment of Ottawa’s resale market.
Months of inventory for apartments increased from 6.3 to 7.3 months, while the sales-to-new-listings ratio fell from 43.0% to just 27.0%.
The apartment benchmark price was $380,800, down 6.1% from September 2025 and 3.1% from August.
Interestingly, the average apartment sale price increased 0.9% year over year. The difference between the average sale price and the benchmark suggests that the types of apartments sold during the month helped support the average, even as underlying values weakened.
For apartment owners and investors, the growing supply relative to sales is a trend worth watching closely.
Ottawa’s Suburban Markets Continue to Lead
Ottawa’s suburban markets remained the strongest contributors to overall activity in September.
The three suburban areas accounted for 734 sales, or approximately 73% of all citywide transactions. However, that figure was still down 8.0% from the 798 sales recorded in September 2025.
Among the suburban markets, Ottawa Suburb West showed the strongest absorption, with a sales-to-new-listings ratio of 40.7% and 3.7 months of inventory.
Ottawa Suburb East recorded 4.3 months of inventory, while Ottawa Suburb South had 4.4 months.
Conditions were more supply-heavy in Ottawa Centre and the rural markets. Ottawa Centre recorded 6.8 months of inventory and a sales-to-new-listings ratio of 27.6%.
Rural markets also saw elevated inventory, with 6.5 months in Ottawa Rural South, 6.3 months in Ottawa Rural East and 5.8 months in Ottawa Rural West.
The smaller number of monthly transactions in some rural areas means individual months can produce larger swings in percentage terms, so these figures are best considered as part of the broader trend rather than in isolation.
What Should Buyers and Sellers Expect This Fall?
The key question heading into October and November is whether September’s increase in inventory will prove temporary or become a longer-lasting feature of the market.
New listings have historically declined during October and November, which means some of September’s additional supply may naturally work its way out of the market as the year progresses.
If listings begin to decline while sales remain steady, absorption could improve. On the other hand, if inventory remains elevated, sales continue to lag behind new listings and the HPI continues to decline, it would provide stronger evidence of a broader adjustment in home values.
Affordability and borrowing costs continue to influence buyer demand, while the increased number of available properties gives buyers more opportunities to be selective.
New construction is another trend worth keeping an eye on. According to the Greater Ottawa Home Builders’ Association, 464 new homes were sold in Ottawa in August — up 9.7% from July and 55.2% compared with August 2025. Year-to-date new-home sales were also significantly higher.
The expansion of HST relief for qualifying new homes may be contributing to the increased appeal of new construction, although the sales figures alone cannot establish how much of the increase is attributable to the tax change.
The Bottom Line
September’s Ottawa real estate numbers point to a market that is becoming more balanced — and, in some segments, increasingly favourable to buyers.
Sales were relatively stable compared with August, but the sharp increase in new listings created more competition among sellers and pushed inventory higher. Average and median prices remained relatively steady, while the MLS® Home Price Index showed more noticeable underlying softness.
The suburban markets continue to account for the majority of Ottawa’s activity, while apartments, downtown properties and some rural areas are experiencing higher levels of inventory and weaker absorption.
For buyers, the current environment provides more choice and potentially more negotiating power. For sellers, accurate pricing and a strong marketing strategy are becoming increasingly important.
The next few months will be particularly telling. As the usual seasonal decline in listings takes place, October and November should provide a clearer indication of whether September represented a temporary increase in supply or the beginning of a more prolonged period of elevated inventory.